


 71 / 80

STAKEHOLDER ENGAGEMENT
| SOCIETY | REGULATORS | SHAREHOLDERS | MEDIA | CUSTOMERS | BUSINESS PARTNERS
| EMPLOYEES |
71
EMPLOYEES
We are committed to being a world-class employer of choice and take our responsibility
to maintain a productive, supportive and safe working environment seriously. Our vision of
transforming lives begins with transforming the lives of our employees and a key aspect of this vision
is to create a supportive working environment that allows us to attract, develop and retain the
best staff. We classify our employees by the following attributes: age, gender, job grade, location
and contract status (permanent or contractor). We measure staff morale using an annual ‘SEMA
Survey’, staff turnover rates, the Staff Council and the ‘Sema na CEO’ chat room.
STABLE WORKFORCE DEMOGRAPHICS
The overall demographics of our workforce remained stable during the year. The closing employee
number stands at 5,085, with the majority of our employees remaining Kenyans in their 30s, based
in Nairobi. While the general demographics of our workforce remained steady during the year,
it is interesting to note that we became slightly younger as an organisation in FY17, with the ranks
for employees aged between 20 and 29 years old swelling to 1,079 people or 21% of the total
workforce. Most employees are still aged between 30 and 39 years old, nonetheless, with this age
bracket accounting for 3,231 people or 64% of the total company.
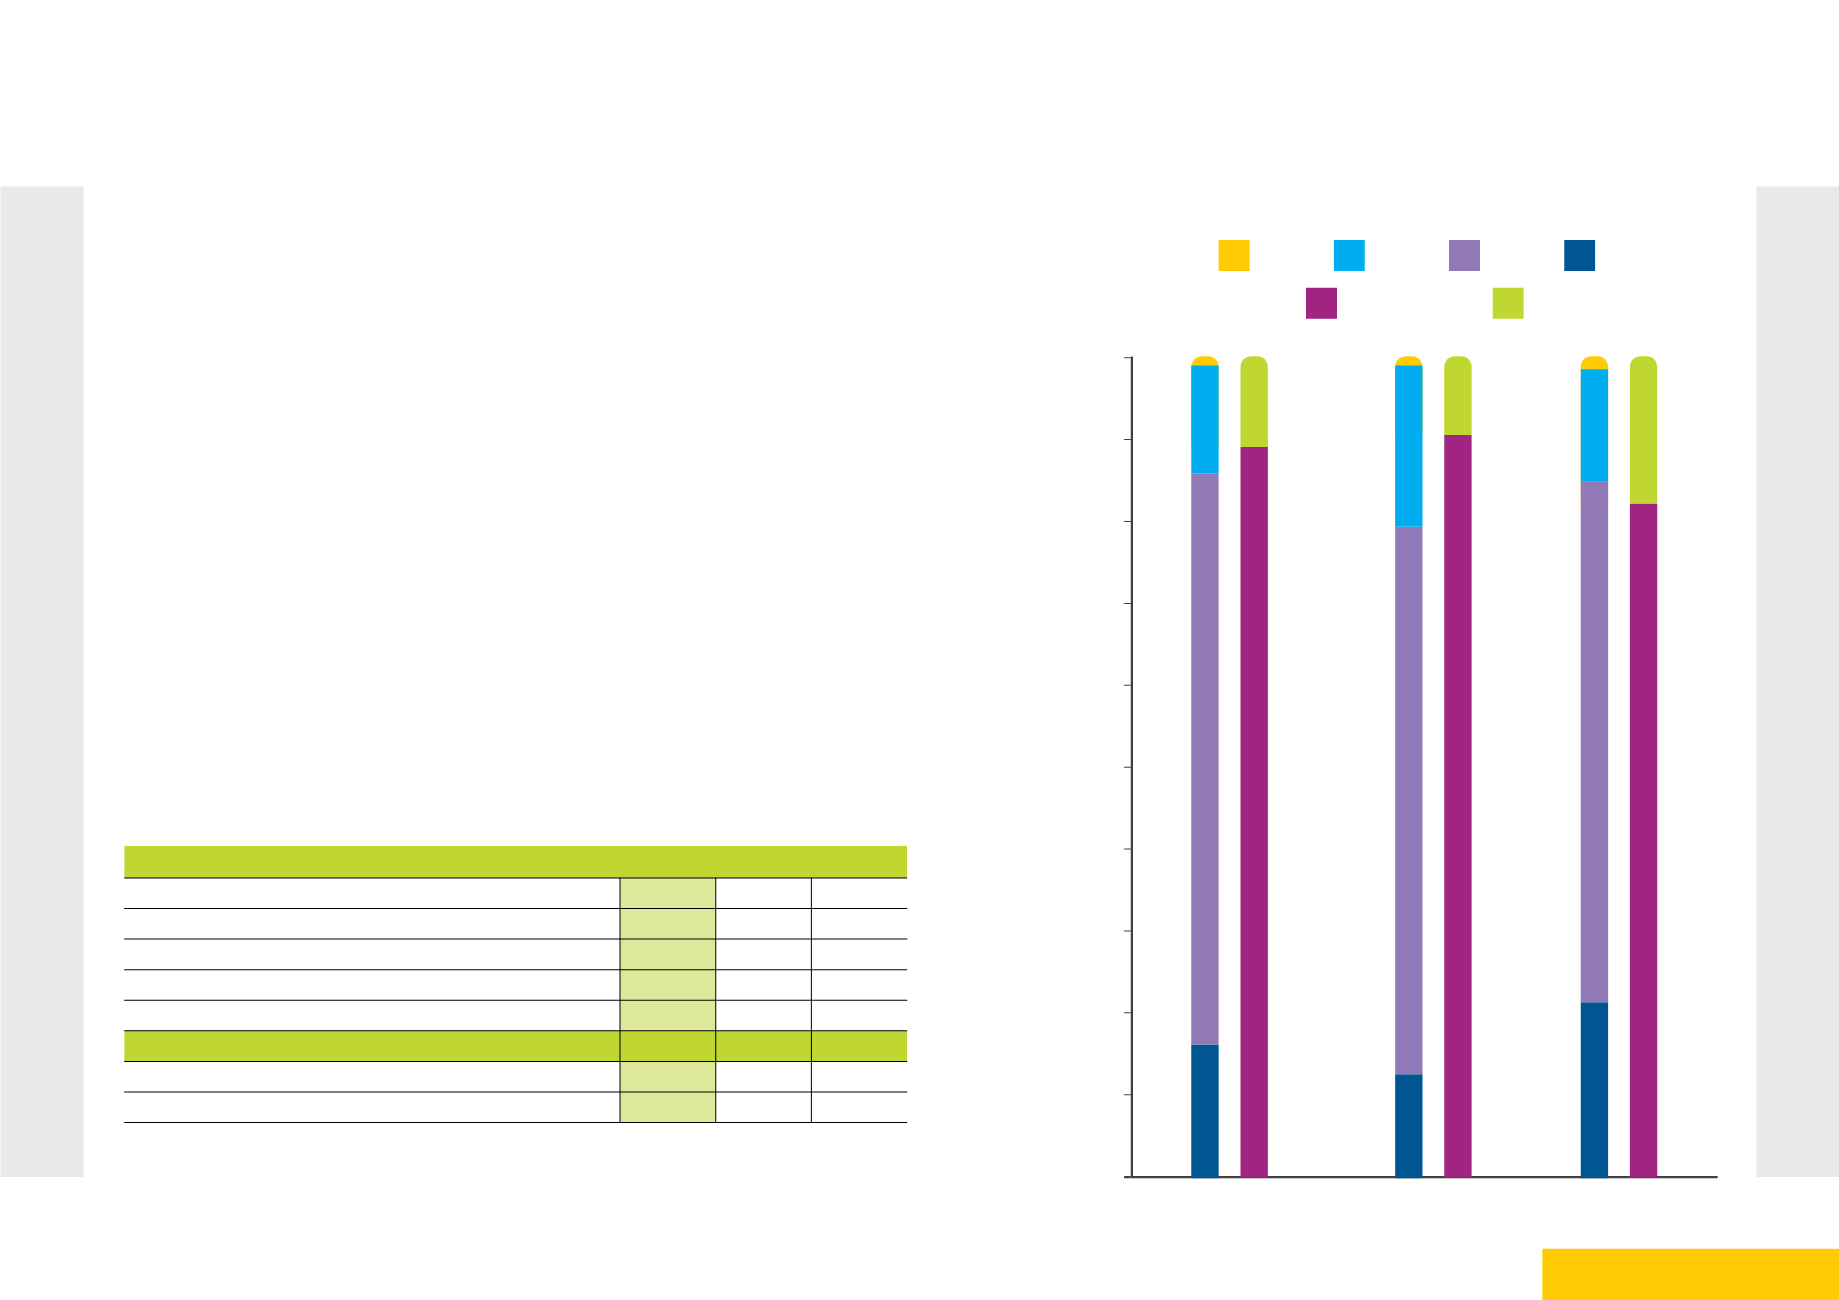
EMPLOYEES BY AGE BRACKET
FY17
FY16
FY15
20s
21.23% 13% 16%
30s
63.58% 67% 70%
40s
13.75% 19% 13%
50s
1.36% 1%
1%
60s
0.08% 0.1% 0.1%
EMPLOYEEES BY CONTRACT STATUS
Permanent
4,245
4,287
4,192
Contract
845
468
515
The size of our permanent workforce remained constant during the year, decreasing by around
1% or 42 employees to 4,245 permanent members of staff.
Employees by Age Bracket
FY15
FY16
FY17
50s+
40
30s
20s
Permanent
Contractor
10%
0%
20%
30%
40%
50%
60%
70%
80%
90%
100%