


 65 / 80

STAKEHOLDER ENGAGEMENT
| SOCIETY | REGULATORS | SHAREHOLDERS | MEDIA
| CUSTOMERS |
BUSINESS PARTNERS | EMPLOYEES |
65
In order to serve the needs of our consumer customers better, we classify these
customers into four main market segments: the Youth, the Masses, Hustlers, and
Discerning Professionals. While we are pleased to report that we exceeded our
target in the Hustlers segment, which we ascribe to the popularity of the FLEX
product launched during the year, we failed to achieve our targets in the other
three segments because it was our first year of targeting these new segments
and our customer classification rules changed during the year (as we learnt more
about our customer segments). We have learnt much and have streamlined
customer targets and classifications for the year ahead. Despite not reaching
our overall target for Youth customers, we made good progress during the year
and our BLAZE platform already enjoys 1.6million subscribers. Both the Youth
and Mass segments have grown significantly during the year and we have also
seen a satisfying spike in Consumer NPS as well
(see table on page 42 for more
information)
.
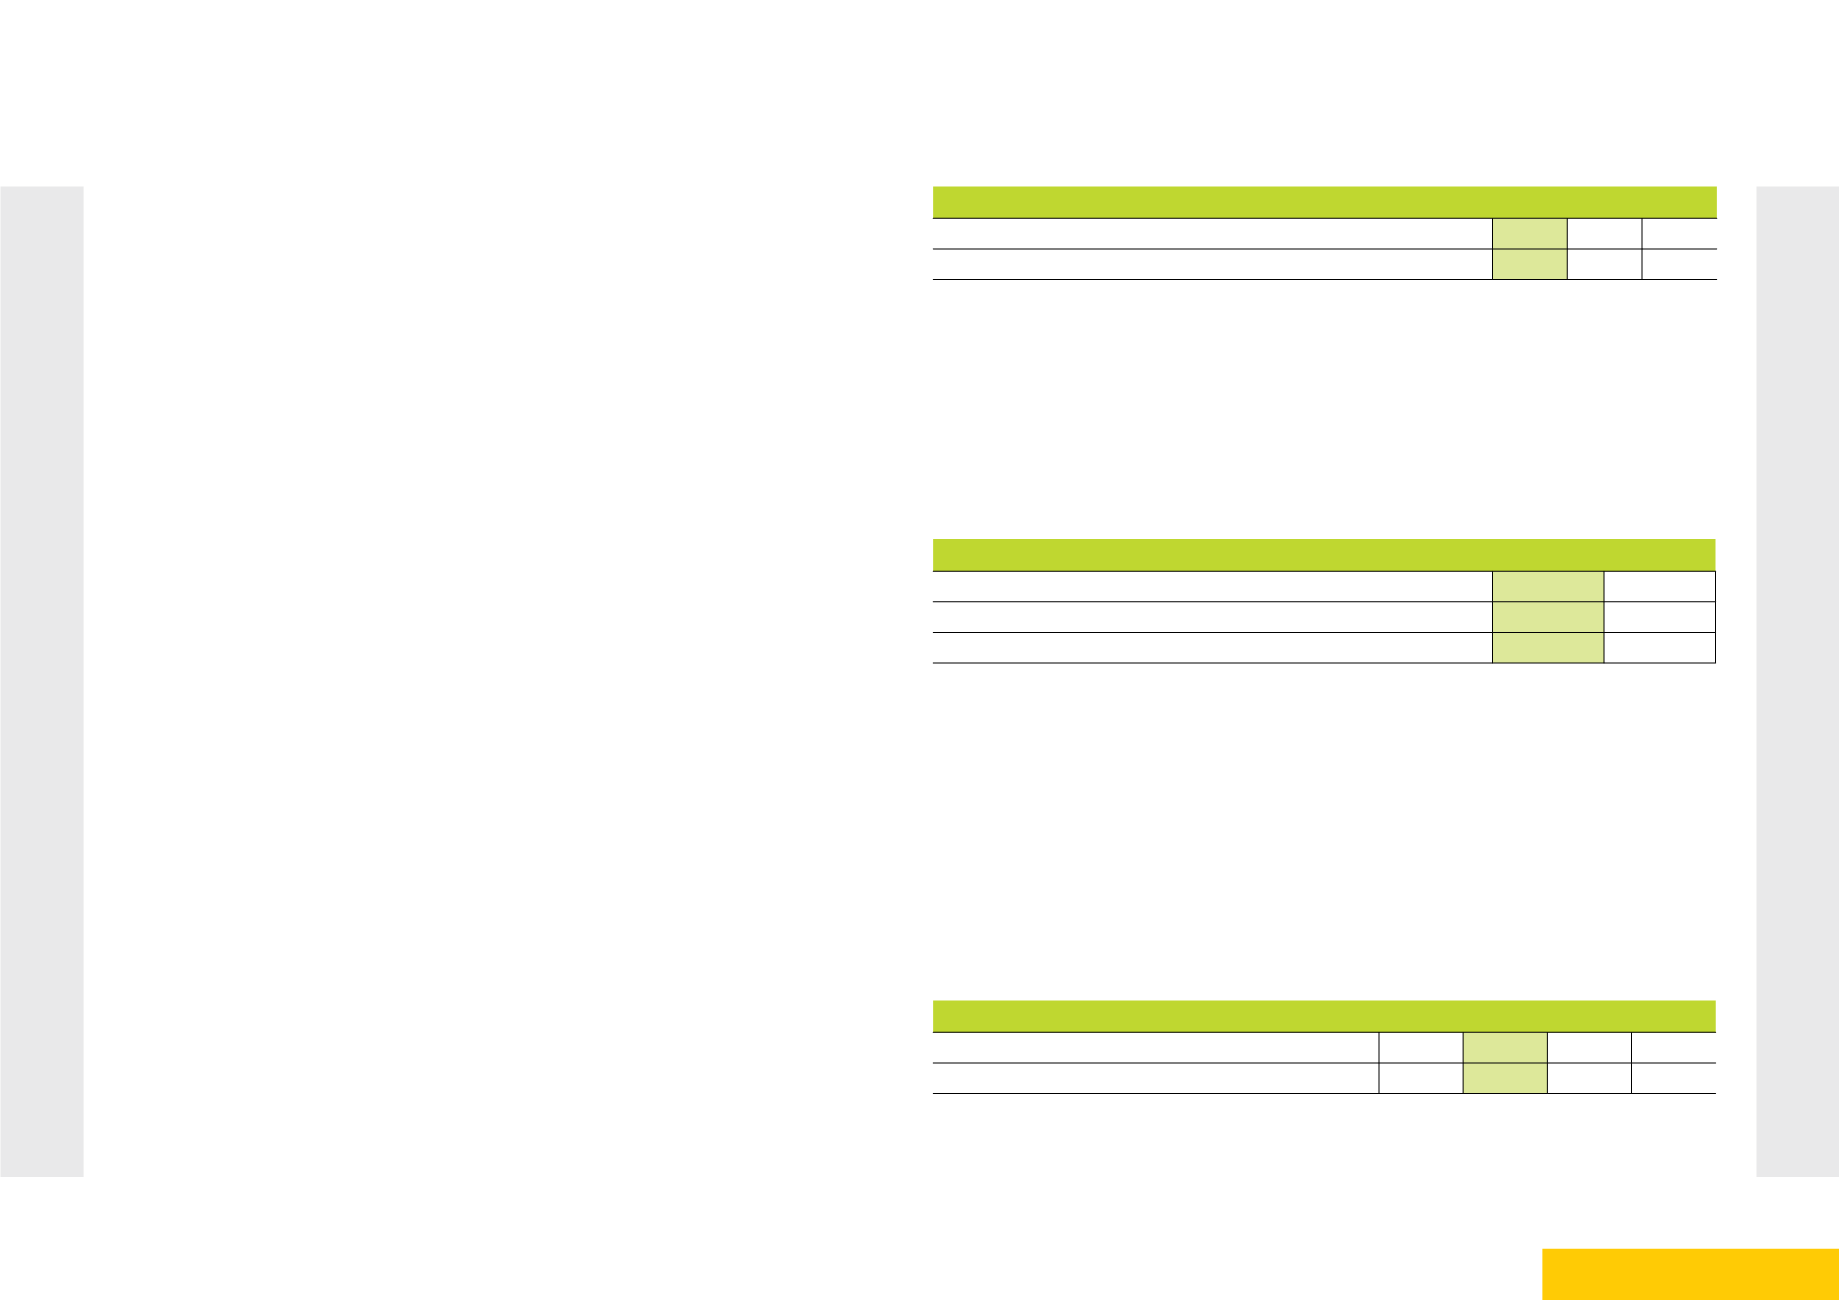
ENTERPRISE CUSTOMERS
Enterprise customers are split into four major groups: Large Enterprises; Public
Enterprises; Small-to-Medium Enterprises (SMEs); and Small Offices-Home Offices
(SOHO). We currently have a presence in 96,712 enterprise customers, which
represents an increase of 12,712 from the previous year. Most of this growth is
attributable to our significant acquisitions in the SME segment.
FY17 FY16 FY15
Number of Enterprise Customers
96,712 84,000 67,925
Market Share by Revenue
61% 54% 49%
While the SME segment has seen solid growth during the year, large enterprise
customers still account for most of enterprise customer revenue and so our focus
has remained on nurturing long-term relationships and up/cross-selling in this
market segment. We are pleased to report that we grew large enterprise revenue
specifically by 44% in FY17 and now enjoy 61% market share overall in terms of
revenue in the Kenyan enterprise space.
Enterprise Market Share by Segment (% Customers)
FY17
FY16
Large Enterprises (Public and Private Sector)
99%
99%
SMEs
20%
13%
SOHOs
11%
5.2%
MONITORING OUR PERFORMANCE
We continue to use the Net Promoter score (NPS) to monitor customer satisfaction.
NPS measures the likelihood that a customer would recommend Safaricom to
other businesses or friends, based on their overall experience. NPS is measured
separately for consumer and enterprise customers. Our ongoing NPS targets are
to be the number one integrated communications service provider by a margin
of 5% for consumer customers and 10% for enterprise customers, relative to our
nearest competitors. The following table presents a breakdown of our NPS.
NPS RESULTS
TARGET FY17 FY16 FY15
Consumer NPS (Competitor Margin)
5% 8% 10% 4%
Enterprise NPS (Competitor Margin)
10% 20% 19% 28%