


 59 / 80

STAKEHOLDER ENGAGEMENT
| SOCIETY | REGULATORS
| SHAREHOLDERS |
MEDIA | CUSTOMERS | BUSINESS PARTNERS | EMPLOYEES |
59
SHAREHOLDERS
Our shareholders expect us to remain a high-performing company that balances
delivering consistent and sustainable financial returns against ethical and
environmentally responsible operation. As a reflection of this, they expect us to
retain a stable, experienced and proven management team and to uphold the
very highest standards of corporate governance and practices.
SHAREHOLDING STRUCTURE
Our shareholding structure remained unchanged during the year and continues
to be composed of the Government of Kenya (35%), Vodafone (40%) and free
float (25%).
SHAREHOLDERS
FY17 FY16 FY15
Vodafone
40% 40% 40%
Government of Kenya
35% 35% 35%
Free Float
25% 25% 25%
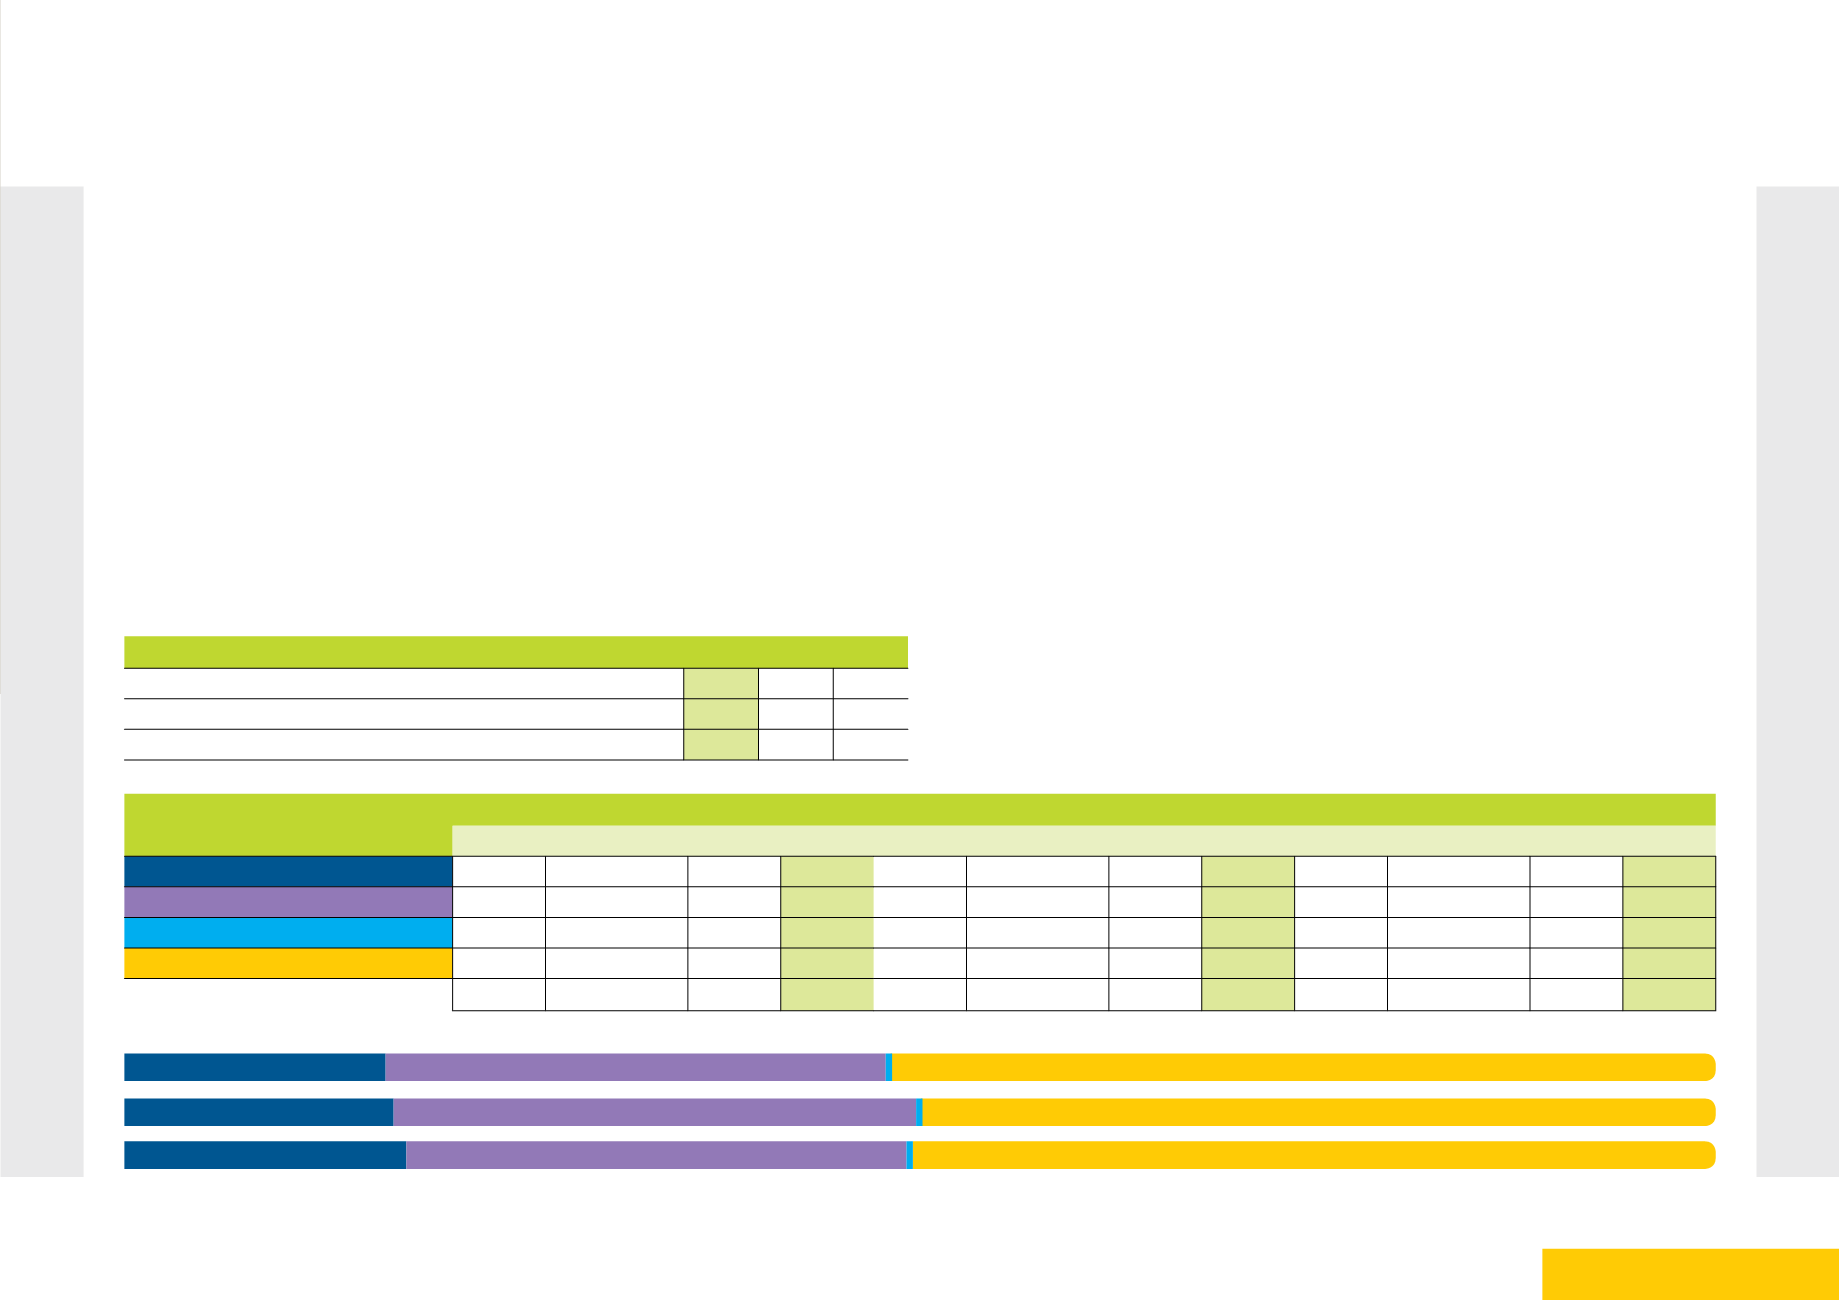
CATEGORY
FY17
FY16
FY15
No.
Share Value
% % Value No.
Share Value
% % Value No.
Share Value
% % Value
East African Individual
563,956 1,645,340,605 96.8% 16.4% 581,417 1,696,263,381 96,8% 16,9% 603,920 1,782,312,461 96.8% 17.7%
East African Corporate*
16,878 3,155,545,824 2.9% 31.4% 17,481 3,291,772,051 2.9% 32.8% 18,092 3,154,925,327 2.9% 31.4%
Foreign Individual
1,573
42,201,584
0.3% 0.4% 1,601
41,233,651
0.3% 0.4% 1590
42,181,444
0.3% 0.4%
Foreign Corporate
366 5,199,767,407 0.1% 51.8% 330 5,013,586,337 0.1% 49.9% 272 5,063,436,188 0.0% 50.4%
* Excludes VF shares - 16bn and GoK - 14bn
582,775 10,042,855,420
100.0% 100.0%
600,831 10,042,855,420
100.0% 100.0%
623,874 10,042,855,420
100.0% 100.0%
While the overall shareholding structure hasn’t changed, we have noticed a
decline in retail shareholders and an increase in corporate shareholders within
the ‘free float’, especially foreign corporates. The following table presents the
movements in proportions of our shareholder categories from March 2015 to
March 2017.
As the table below illustrates, foreign corporates hold the highest proportion of
the free float, approximately 52%. While the number of local companies holding
shares in Safaricom has been on a decline, the proportion of shares they hold
has also been decreasing and, currently, these companies hold 31.4% of the
free float. Holdings by both retail and corporate local investors have been on a
decline. We attribute this partially to profit taking as the share rose to new levels.
Holdings by both individual and corporate foreign investors have been on an
increase as they take positions in Safaricom attracted by its performance and
strong fundamentals.
FY17
FY16
FY15