


 38 / 80

OUR MATERIAL MATTERS
| GOVERNANCE, RISK & REGULATION | NETWORK QUALITY
| ENVIRONMENTAL RESPONSIBILITY |
INNOVATION |
38
Our water usage increased by 2% to 96,650 m3 and our electricity consumption
increased from 107,977 MWh in FY16 to 116,988 MWh in FY17. The increase in
electricity consumption is due to a change in the way we calculate our usage.
We used to base our calculations on the data provided in utility power bills for
individual sites, but data collection challenges and discrepancies in reconciling
this underlying data prompted us to change our methodology to improve the
accuracy and consistency of our reporting. We now calculate our consumption
based on the ‘cost of power’ using the exact amounts as paid by the Finance
Department to the Kenya Power and Light Company. It is worth noting that we
are comfortable with our electricity consumption rising (and rising in the mix) given
the fact that electricity produced in Kenya by the KPLC is mainly from renewable
sources, which is aligned with our SDG commitment to using environmentally
‘cleaner’ energy wherever possible. At this stage, we have only recalculated the
FY17 electricity consumption based on improved data, but we are working on
reviewing earlier data to established clearer trends.
As part of our commitment to SDG7, we also developed an Energy Policy during
the year. The policy will guide and focus our ongoing efforts in this regard and has
helped prioritise our research of, and investment in, clean energy technologies.
MANAGING OUR EMISSIONS
In response to the SDG strategy, we have committed to becoming a net zero
carbon-emitting company by 2050. As one of the few companies in Africa to
have made this commitment, we are rolling out renewable energy solutions
across our network and facilities, as well as considering carbon offset proposals for
sources where renewable energy may not be feasible with current technology; for
example, planting trees and providing subsidised domestic solar energy solutions.
As part of our commitment to meeting the net zero carbon target, we continue to
monitor and report our carbon footprint. We have calculated and published our
carbon footprint for the sixth time this year.
As the preceding table shows, our overall footprint has decreased to 78,927
tCO2e this year, down from a revised figure of 79,781 tCO2e in FY16. The slight
decrease in overall footprint is the result of a decrease in ‘Scope 1’ emissions,
which reflects the decrease in diesel consumed in our generators. The increase
in ‘Scope 2’ emissions is due to elevated electricity consumption as a result
of continued network expansion and an SDG-related strategic shift to using
electricity instead of diesel wherever possible because it is an environmentally
‘cleaner’ source of power.
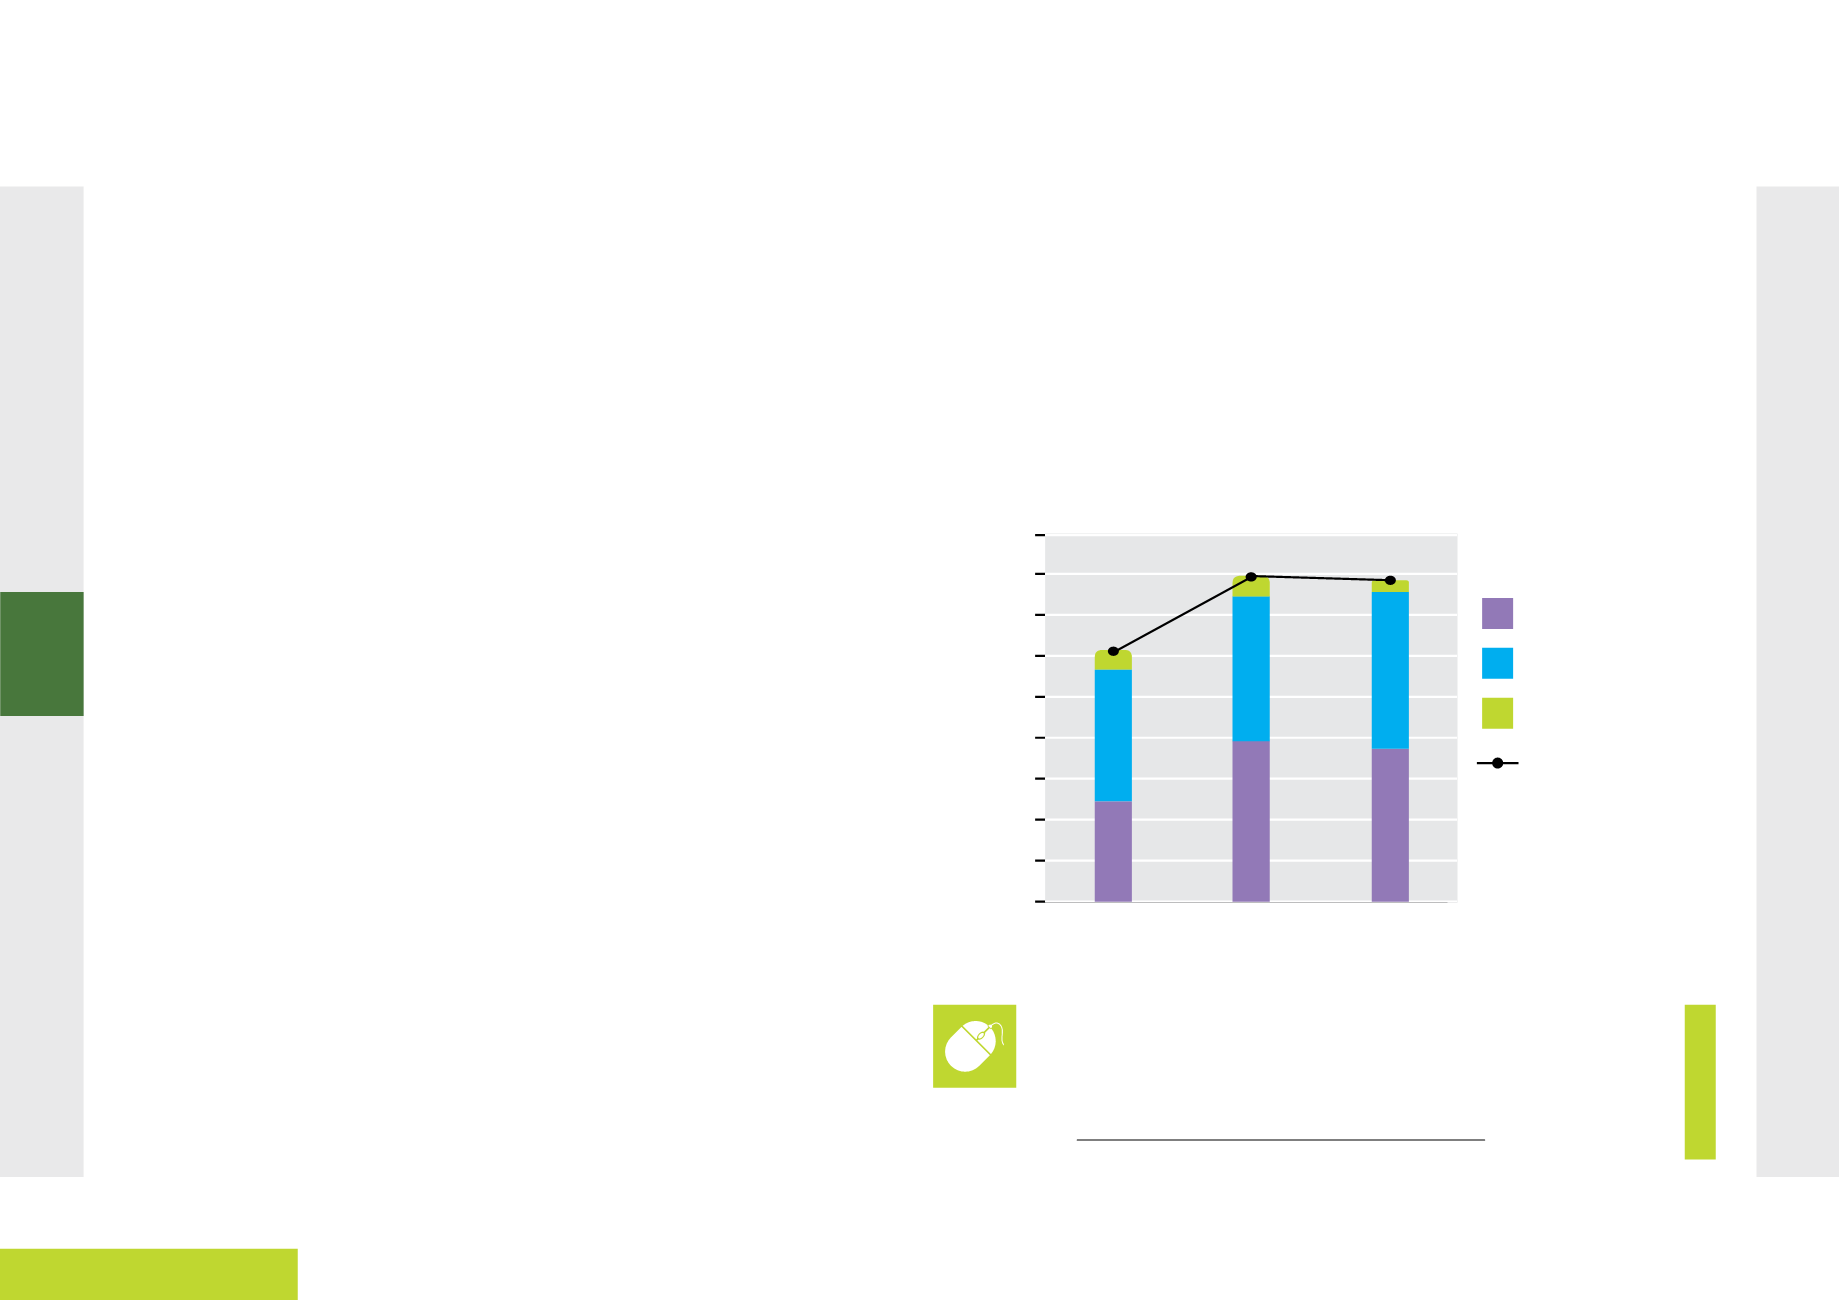
SDG 13
Carbon Footprint
Scope 1 Emissions
Scope 2 Emissions
Scope 3 Emissions
Total Emissions
FY15
FY16
FINANCIAL YEAR
CARBON EMISSIONS (tCO2e)
FY17
78,927
79,781
61,452
80,000
90,000
70,000
60,000
50,000
40,000
20,000
30,000
0
10,000
For more detailed information regarding the methodology/guidelines
and processes we use to calculate our emissions, please see the
About our reporting
Appendix to this report, which has been published online
at
https://www.safaricom.co.ke/sustainabilityreport_2017/