


 34 / 80

OUR MATERIAL MATTERS
| GOVERNANCE, RISK & REGULATION
| NETWORK QUALITY |
ENVIRONMENTAL RESPONSIBILITY | INNOVATION |
34
NETWORK AVAILABILITY AND STABILITY
The stability and availability of our network remains a critical necessity. Any
interruption in energy supply, such as grid electricity outages and national
shortages of diesel fuel, poses a direct challenge to the continuity of our
operations. Our response to this issue is primarily managed through our service
and energy availability rates. Our Service Unavailability Rate (SUR) is calculated
by dividing the minutes of downtime per week per network element by the
number of sites in our network.
FY17 FY16 FY15
Radio Access Network Service Unavailability Rate (minutes)
22.9 41.5 60.03*
* SUR measurement started midway through the financial year.
As the preceding table shows, the SUR for the Radio Access Network was reduced
from 41.5 minutes in FY16 to 22.9 minutes in FY17. While the reduction is a satisfying
achievement and reflects the stability of our network, our target for the year was
an SUR of below 20 minutes. The major contributors to our FY17 SUR were Power
Outages and Transmission Failures caused by fibre cuts, in particular. Small Cells
also contributed to our failure to achieve the target due to their lower resilience.
Insecurity in parts of the country also had an impact on the restoration of services
at remote locations.
ENERGY EFFICIENCY
Our network uses a variety of energy sources, including national grid, diesel
generator, deep cycle battery and renewable energy (solar) solutions. The
network continues to grow in size and sophistication every year and so making
it more energy efficient and intelligent remains an ongoing priority. Our vision
is still to create a powerful, streamlined network that uses the minimal amount
of energy to deliver its growing array of services. One that transforms the lives
of the communities it serves with the lightest of environmental touches. One
way we manage this ambition is to measure our performance against energy
consumption targets (reducing the amount of energy consumed at sites by
deploying more energy-efficient technologies and alternative energy solutions).
* Energy consumed is electricity, diesel and solar. The sources are supplier monthly fueling data and KPLC bills. Solar
energy is only measured at some sites, as such we have extrapolated the solar data to the other sites. Energy mix
influences the cost.
SDG 9
SDG 7
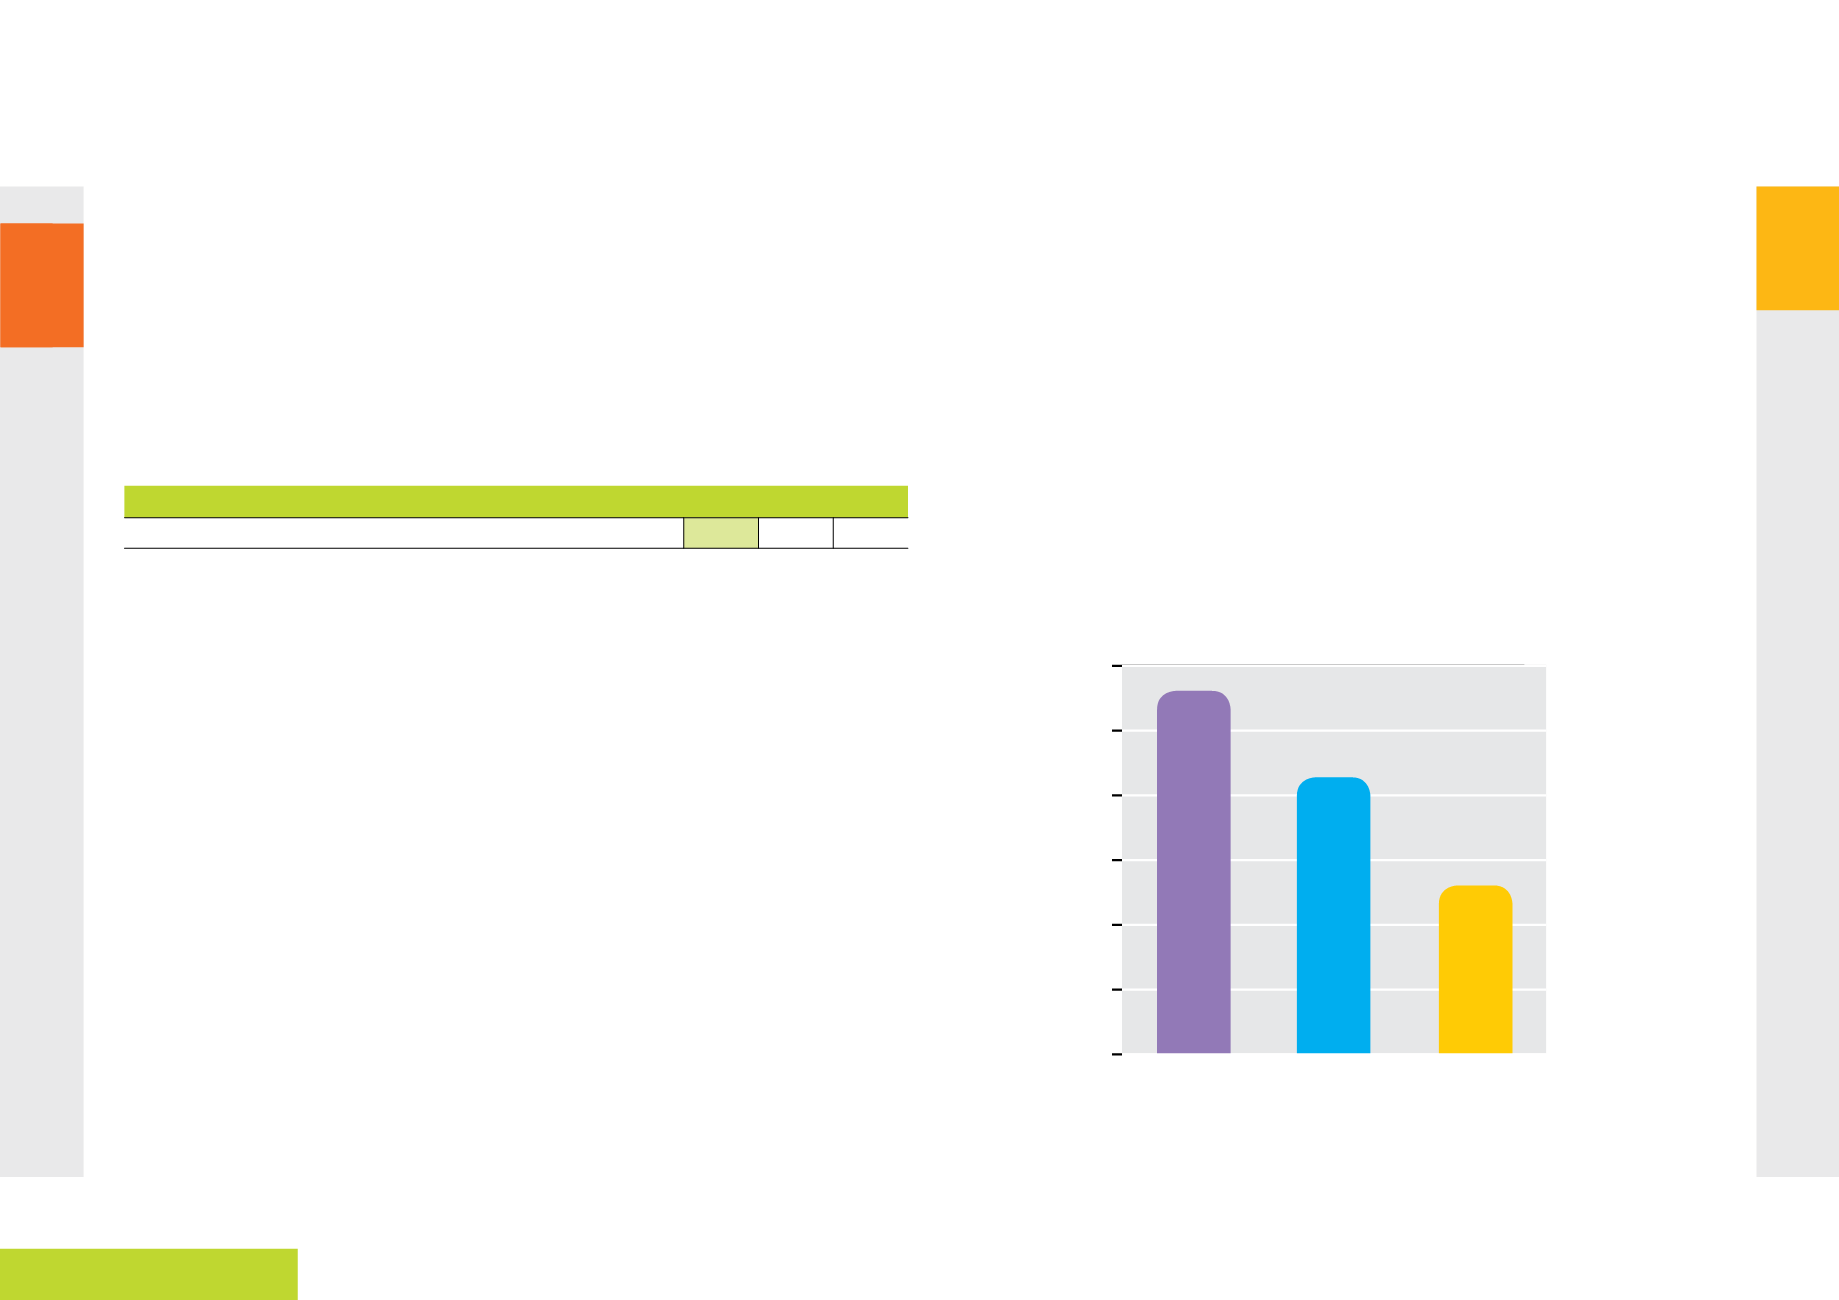
FY15
48,614
52,000
51,000
50,000
49,000
48,000
47,000
46,000
51,626
50,292
FY16
FY17
Cost of Energy Consumption by Site*
YEAR
COST PER MONTH (KES)
“Our vision is still to create a powerful,
streamlined network that uses the
minimal amount of energy to deliver its
growing array of services.”