


 70 / 84

Safaricom Sustainability Report 2016
70
SHAREHOLDERS
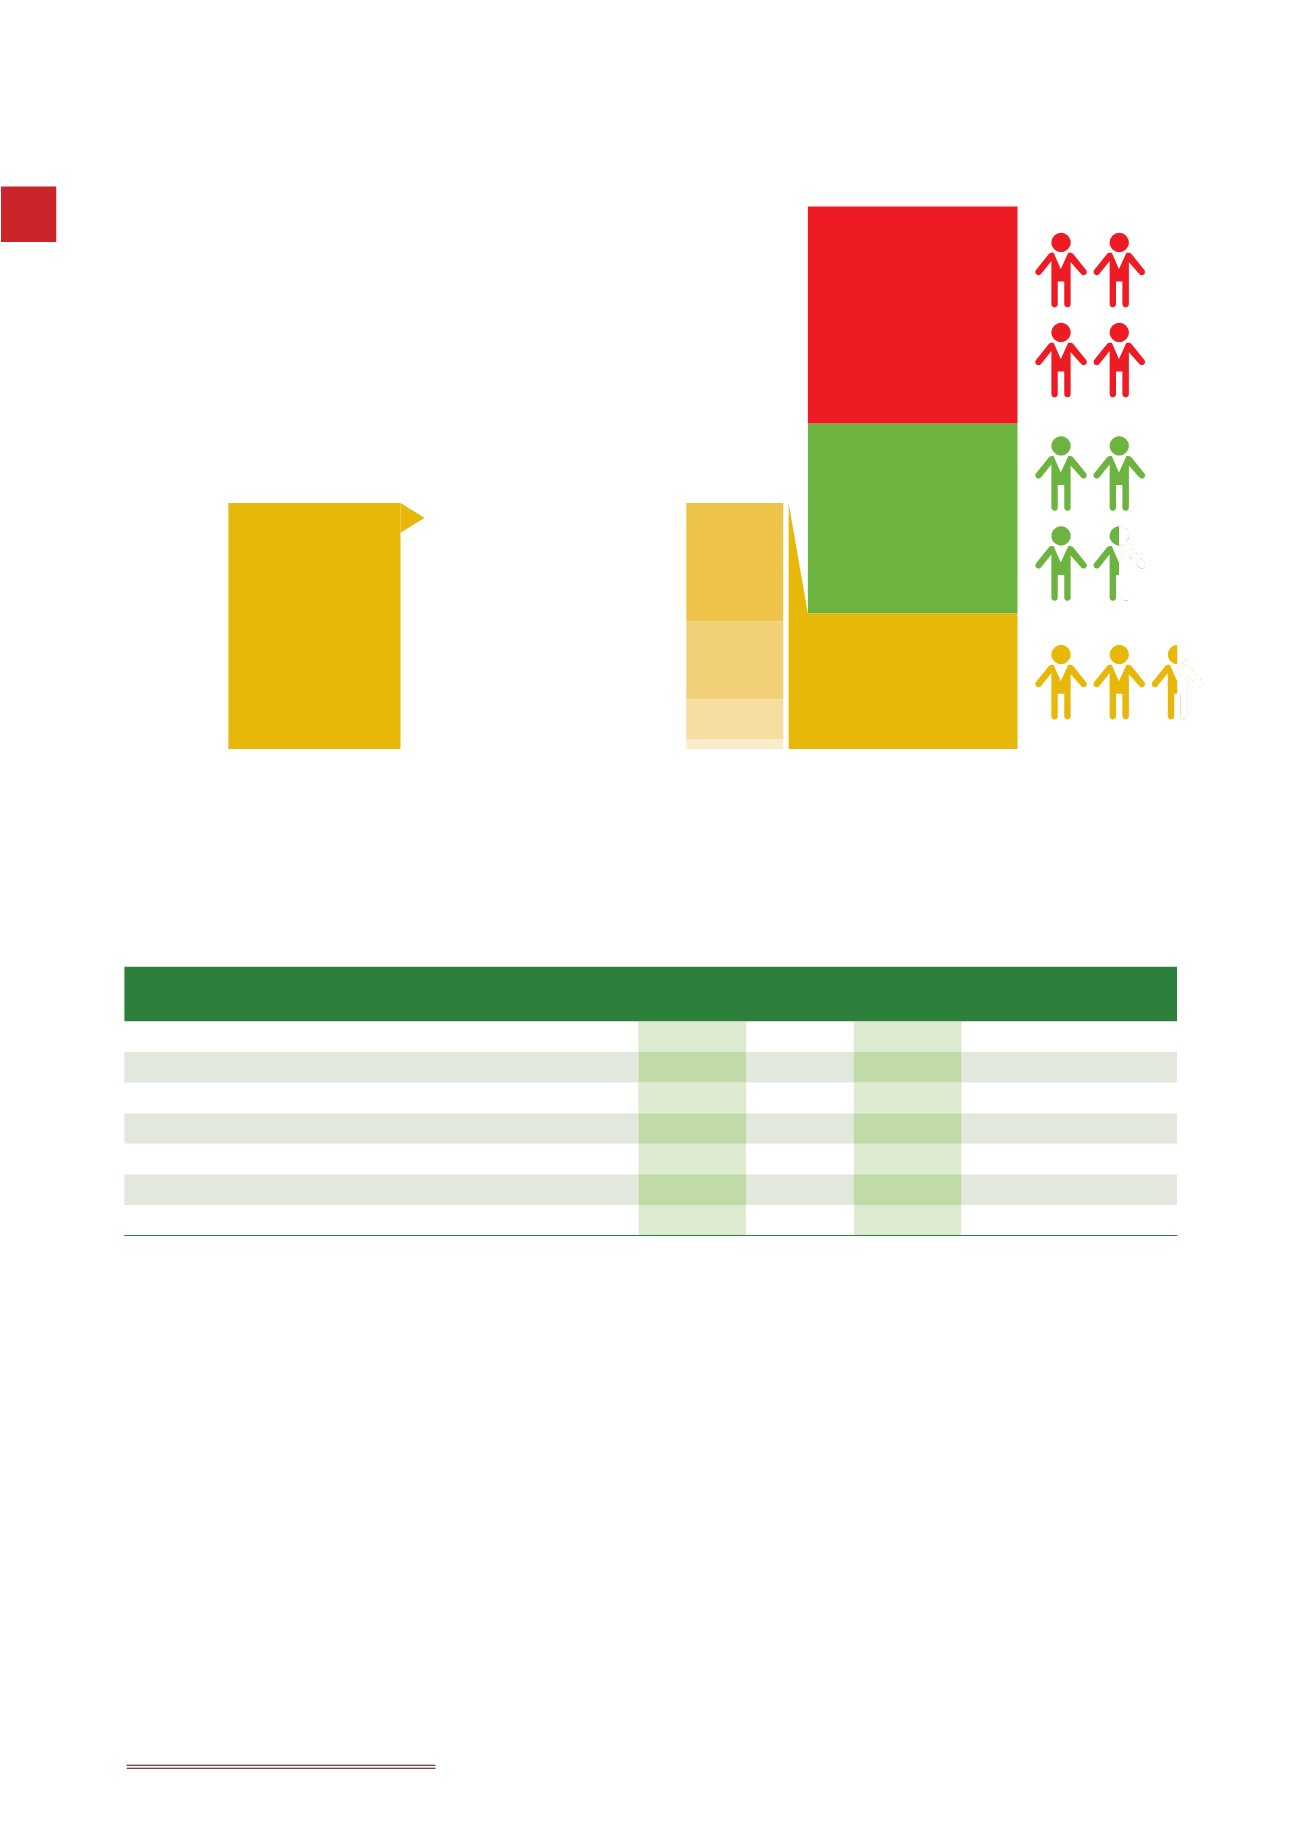
Our shareholding structure is composed of the Government of Kenya (35%);
Vodafone (40%) and free float (25%).
While the overall shareholding structure hasn’t changed, we have noticed
a decline in retail shareholders and an increase in corporate shareholders
within the ‘free float’, especially local companies. The following chart
presents the movements in proportions of our shareholder categories from
March 2015 to March 2016.
VODAFONE
40%
GOVT.
OF KENYA
35%
FREE FLOAT
25%
Foreign Corporate
ò
0.5ppt to 49.9%
Local Corporate
ñ
1.4ppt to 32.8%
Local Individual
ò
0.9ppt to 16.9%
Foreign Individual
ò
0.01ppt to 0.4%
MOVEMENTS IN
PROPORTIONS
OF ‘FREE FLOAT’
SHAREHOLDERS
BY CATEGORY
As the preceding chart shows, foreign corporates hold the highest proportion of the free float, approximately 50%. While the
number of local companies holding shares in Safaricom has been on a decline, the proportion of shares they hold has been
increasing, currently these companies hold 33% of the free float). We attribute this trend to profit taking among small-scale
retail investors, with lager investors and foreign corporates picking up the shares.
SHAREHOLDING BANDS
Shareholding Band
Mar’16
% Mar’15
%
YoY %
Change
1 to 1,000
386,151 64.27% 397,215 63.67% 0.60%
1,001 to 10,000
189,837 31.60% 200,039 32.06% -0.47%
10,001 to 100,000
22,234
3.70% 23,954
3.84% -0.14%
100,001 to 1,000,000
1,955
0.33% 2,066
0.33% -0.01%
1,000,001 to 10,000,000
465
0.08%
428
0.07% 0.01%
10,000,001 to 100,000,000
176
0.03%
161
0.03% 0.00%
Over 100,000,000
11
-
11
-
-
The preceding table shows that 95% of our shareholders hold a maximum of 10,000 shares and are mostly comprised of the
local individuals; however, the number of the local individual shareholders continue to decline.
How did we deliver value to them during the year?
We deliver value to our investors through our strong financial performance and through how we engage and communicate
with them.
Financial performance:
We delivered strong financial performance again this year, which has resulted in further dividend growth and share
appreciation:
•
Achieving an EBITDA of KSh 83.1bn, up 16.7% from FY15, with an EBITDA margin of 44.6
•
Achieving a 19.6% increase in net income (increase to KSh 38.1bn)
•
Proposing a dividend per share of KSh 0.76, which is 18.9% higher than last year
•
Increasing our free cash flow by 10.3% to KSh 30.4bn